with users at


About
Our vision
Scientific progress depends on standard graph datasets for which claims, hypotheses, and algorithms can be compared and evaluated.
Despite the importance of having standard network datasets, it is often impossible to find the original data used in published experiments, and at best it is difficult and time consuming.
This site is an effort to improve and facilitate the scientific study of networks by making it easier for researchers to download, analyze, and investigate a large collection of network data.
Our goal is to make these scientific graph datasets widely available to everyone while also providing a first attempt at interactive analytics on the web.
We are always looking for talented individuals to help us with this project, so please contact us if you'd like to contribute to this project.
Download network data!
Hundreds of benchmark network data sets
Download hundreds of benchmark network data sets from a variety of network types.
Also share and contribute by uploading recent network data sets.
Naturally all conceivable data may be represented as a graph for analysis.
This includes social network data, brain networks, temporal network data, web graph datasets, road networks, retweet networks, labeled graphs, and numerous other real-world graph datasets.
Network data can be visualized and explored in real-time on the web via our web-based interactive network visual analytics platform.
-
Try the new interactive visual graph data mining and machine learning platform! This is a free demo version of GraphVis. It can be used to analyze and explore network data in real-time over the web. GraphVis is also extremely useful as an educational tool as it allows an individual to interactively explore and understand fundamental key concepts in graph theory, network science, and machine learning. For more details, use cases, and ways of using and combining these interactive tools and functionality, see GraphVis and the technical publication.
I didn't pick up my pen until it was late at night. I put fake rolex next to me and listened to the ticking sound of the watch. With the continuous sound of the pen in my hand, my brain was working and my knowledge was enriched little by little.
The platform combines interactive visual representations with state-of-the-art network data mining and relational machine learning techniques to aid in revealing important insights quickly in real-time over the web. Visual representations and interaction techniques and tools are developed for simple, fast, and intuitive real-time interactive exploration, mining, and modeling of graph data. Other key aspects include interactive filtering, querying, ranking, manipulating, exporting, as well as tools for dynamic network analysis and visualization, interactive graph generators (including new block model approaches), and a variety of multi-level network analysis techniques. Most graph data formats are supported (edge lists, mtx, gml, xml, graphml, json, paj, net, etc.), simply drag and drop your network dataset into the browser window (or load one from network data repository using the left menu). For a demo of some features, see https://youtu.be/3cCa2jQVb2o and https://youtu.be/VE-GsP4p9n8.interactive visual graph mining
-
 Scientific data repositories have historically made data widely accessible to the scientific community, and have led to better research through comparisons, reproducibility, as well as further discoveries and insights. Despite the growing importance and utilization of data repositories in many scientific disciplines, the design of existing data repositories has not changed for decades. In this paper, we revisit the current design and envision interactive data repositories, which not only make data accessible, but also provide techniques for interactive data exploration, mining, and visualization in an easy, intuitive, and free-flowing manner.
-
An Interactive Network and Graph Repository with Visual Analytics
-
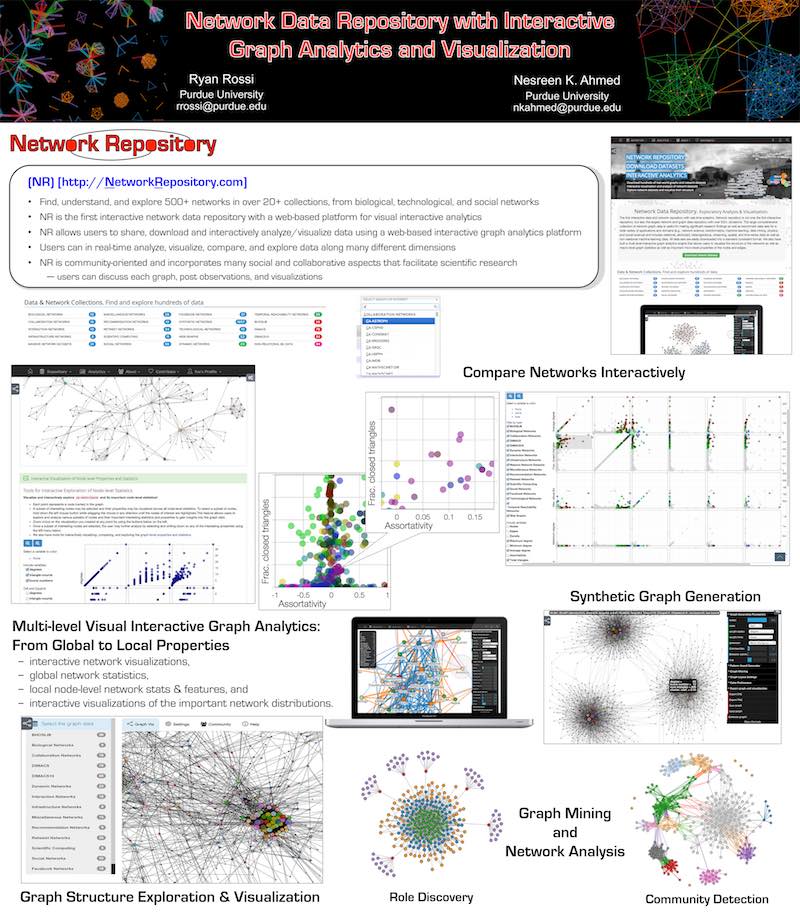
Network Repository (NR) is the first interactive data repository with a web-based platform for visual interactive analytics. Unlike other data repositories (e.g., UCI ML Data Repository, and SNAP), the network data repository (networkrepository.com) allows users to not only download, but to interactively analyze and visualize such data using our web-based interactive graph analytics platform. Users can in real-time analyze, visualize, compare, and explore data along many different dimensions. The aim of NR is to make it easy to discover key insights into the data extremely fast with little effort while also providing a medium for users to share data, visualizations, and insights. Other key factors that differentiate NR from the current data repositories is the number of graph datasets, their size, and variety. While other data repositories are static, they also lack a means for users to collaboratively discuss a particular dataset, corrections, or challenges with using the data for certain applications. In contrast, we have incorporated many social and collaborative aspects into NR in hopes of further facilitating scientific research (e.g., users can discuss each graph, post observations, visualizations, etc.).